R
[R] 시각화 - ggplot histogram,boxplot
ㄷㅐ장님
2022. 1. 28. 15:23
histogram
cost <- read.table("c:/data/cost.txt")
cost <- as.matrix(cost)
dim(cost) <- c(50,1)
hist(cost)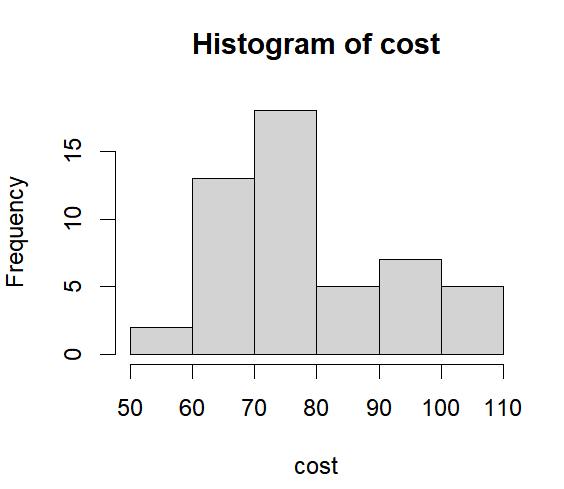
geom_histogram
cost <- read.table("c:/data/cost.txt")
cost <- as.matrix(cost)
dim(cost) <- c(50,1)
cost <- data.frame(cost)
names(cost) <- 'freq'
ggplot(data=cost,aes(x=freq))+
  geom_histogram(binwidth = 10, aes(fill=..count..),colour='red')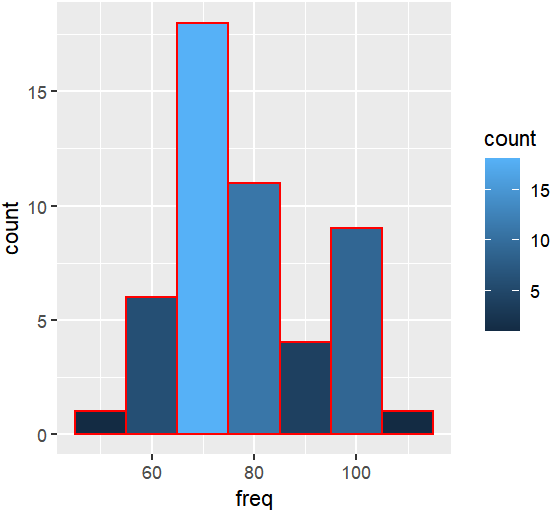
boxplot
cost[50,] <- 200
boxplot(cost)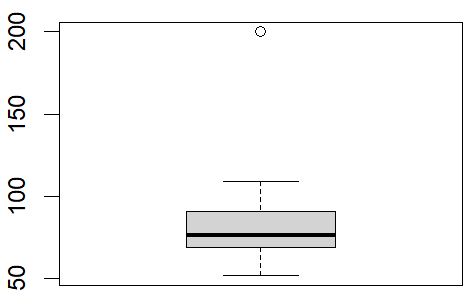
2)
boxplot(store$A,store$B,store$C)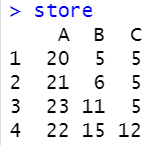
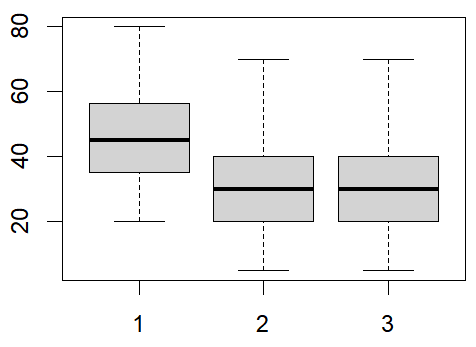
geom_boxplot
ggplot(data=cost,aes(x=1,y=freq))+
  geom_boxplot(outlier.color = "red",outlier.shape = 10)+
  coord_flip()+#세로
  stat_summary(fun='median',geom='point',shape=22,fill='blue',size=2)+
  stat_summary(fun='mean',geom='point',shape=25,fill='red',size=2)+
  stat_summary(fun='quantile',geom='point',shape=21,fill='red',size=2)+
  geom_jitter(width=0.1,alpha=0.3) #값이 어디에 모여있는지 확인 width:모이는 정도 alpha:투명도
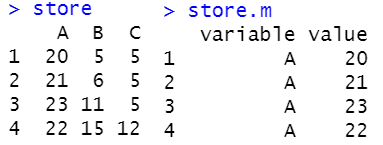
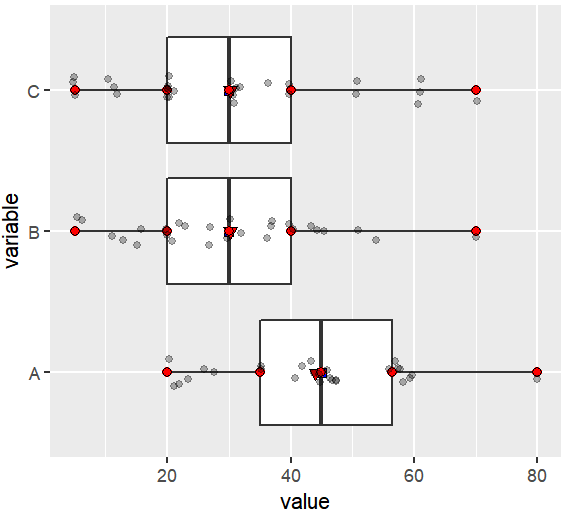
2)
store.m <- melt(store,measure.vars = c('A','B','C'))

ggplot(data=store.m,aes(x=variable,y=value))+
  geom_boxplot(outlier.color = "red",outlier.shape = 10)+
  coord_flip()+#세로
  stat_summary(fun='median',geom='point',shape=22,fill='blue',size=2)+
  stat_summary(fun='mean',geom='point',shape=25,fill='red',size=2)+
  stat_summary(fun='quantile',geom='point',shape=21,fill='red',size=2)+
  geom_jitter(width=0.1,alpha=0.3)